Corrigendum — Post-Deposit Review, July 2026 This paper carries a live DOI (10.5281/zenodo.20779418). The following issues were identified in a post-deposit review and are disclosed here rather than silently edited; a corrected version should be filed as a new Zenodo deposit version superseding this one.
1. Legal citations in §8.1 do not support the claims made (checked against primary records). The "$320 million 2012 FHA settlement... charged Act/360 rather than Act/365" is a mischaracterization of a real settlement: DOJ's July 2014 (not 2012) $320M settlement with SunTrust Mortgage, Inc. concerned misrepresentations to borrowers and mishandling of Home Affordable Modification Program (HAMP) applications — not day-count convention or Act/360 computation in any respect. The dollar figure is real; the legal basis attributed to it is not. Separately, "Komatsu Financial v. Wells Fargo Bank" (N.D. Ill. 2015) does not exist as described. There is a real 2015 N.D. Ill. case involving Komatsu — Hill v. Komatsu America Corp. (Aug. 26, 2015, Judge John W. Darrah) — but it is a SOX whistleblower retaliation suit by a terminated Komatsu America vice president against Komatsu itself and its CEO, over alleged underfunding of a heavy-equipment warranty reserve fund. No Wells Fargo party, no interest-rate or day-count subject matter, and the court granted summary judgment against the whistleblower, finding the alleged shortfall immaterial (about 0.05% of the parent company's revenue) and his belief that fraud was occurring objectively unreasonable. Even as a corrected citation this case would not support §8's argument — it is, if anything, precedent that immateriality defeats a disclosure-based claim, cutting the other way. Both citations should be removed or replaced with verified precedent before this paper is relied on for the legal argument in §8.2; real, on-point settlements exist in this space (e.g., the 2017 US Bank $200M FHA lending-violation settlement, the PHH Mortgage $45M multistate settlement) and could substitute.
2. LATAM reserve figures updated (§7). Banxico's reserves are corrected from "~$215B" to approximately $240–252B (2025 reporting; year-end 2025 near $251.8B). BCB's reserves are corrected from "~$355B" to approximately $330–344B (mid-2025 reporting; the $355B figure matched 2023 data, not current). The relative ranking — BCB above Banxico — is unchanged. Chile, Peru, Colombia, Uruguay, and Bolivia figures were not independently re-verified in this pass and are carried over from the prior draft; treat those five as unconfirmed to the same standard as before.
3. Custody figure consistency (§5). The JPMorgan AUC figure is reconciled throughout, matching the range already given in reference [6], rather than presenting the upper bound as a precise point figure.
4. Round 2 (following independent re-verification): all four custody figures and six of seven LATAM reserve figures were stale, in some cases substantially. Custody: BNY Mellon $52.1T→$59.4T, State Street $46.6T→$54.5T, JPMorgan $38T→>$40T, Citi $24T→$31T (all early-2026 figures, confirmed against each bank's own reporting). LATAM: Chile corrected down (~$95B→~$52B), Peru corrected up (~$75B→~$100B), Bolivia corrected down sharply (~$10B→~$3.5B, reflecting an active dollar-liquidity crisis), Colombia essentially unchanged (~$60B→~$62B). Uruguay was not independently re-verified. All dependent dollar estimates in §4, §5, and §7 have been recalculated from the corrected bases; the headline $9.6–19.4B and $150–350B aggregate figures elsewhere in the paper have only been partly adjusted (custody channel only) and should be treated as provisional pending a full recalculation.
5. Brazilian supplement (§7.5, added this round). A comparison between Petrobras's international dollar borrowing and Brazilian retail credit rates was added, then corrected: the specific claim that Petrobras borrowing was "routed through the New York branch of Banco do Brasil" at ~3% rested only on the author's personal recollection and has been replaced with the verifiable SEC-filed Petrobras coupon range (2.875–6.875%). A claimed equivalence between the 8%/month cheque especial cap and a "321.1% per year" figure did not hold up arithmetically (compounding gives ≈151.8%/year) and has been corrected to present both real figures as distinct facts rather than one derived from the other. The credit-card revolving rate (443.3% APR, April 2025) and Brazil's constitutional/usury-law history in this section are independently confirmed and unchanged.
See also: WP-31, The Calibration Pipeline — this custody/LATAM re-verification is the corpus's worked example of the validate/iterate stages done right, cited there as a recovered case alongside WP-30's failed one.
Author's Note The author previously worked in the category of institution described in this paper, managing sovereign custody and treasury relationships in global securities services, and observed the mechanism described here in the course of that work. Readers — particularly central bank risk managers and banking supervisors — are invited to test these claims independently using the three diagnostic tests in §10: pull a sample of settlements, compute δr, and report what is found. The arithmetic does not depend on who computes it. 365 divided by 360 is 1.013889 regardless.
Abstract
Banks and global custodians compute interest charges at higher decimal precision than interest payments. This paper identifies, names, and quantifies the mechanism — decimal precision asymmetry — across five channels of the US and global financial system: the USD repo market, commercial loans, global custody cash accounts, securities lending cash collateral, and the domestic deposit base. The mechanism has two layers: (i) a day-count convention asymmetry in which charges are computed on an Act/360 basis while client statements reference Act/365 or stated annual rates, inflating effective charges by a factor of 365/360 ≈ 1.0139; and (ii) a precision truncation asymmetry in which the charge leg is computed at six or more decimal places while the pay leg is rounded to two or three before delivery to the client. The four largest global custodians — BNY Mellon, State Street, JPMorgan, and Citi — hold a combined approximately $185 trillion in assets under custody and administration as of early 2026 (corrected upward from an earlier draft's $160T, which used data roughly a year stale). Even a sub-basis-point precision gap across this base produces annual wealth transfers in the billions of dollars. Across all five channels, the estimated annual cost in the US market alone ranges from $9.6 billion (conservative) to $19.4 billion (adverse). The cumulative cost since computerised settlement became standard in the mid-1980s is estimated at $150–350 billion. For LATAM central banks, the largest single exposed institution is BCB (Brazil, ~$355B in reserves), not Banxico (Mexico, ~$215B). The paper proposes three diagnostic tests any central bank can run using data it already holds, a model disclosure clause for custodian agreements, and a minimum examination standard for banking supervisors.
1. Introduction
Edward Lorenz (1963) observed that infinitesimally small perturbations in initial conditions produce exponentially diverging trajectories in chaotic atmospheric systems. The image that captured the public imagination — a butterfly's wing-beat in Brazil triggering a tornado in Texas — became shorthand for the sensitivity of complex systems to initial conditions. Less noticed is a precise financial analogue: a difference of four to six decimal places in an agreed interest rate, applied consistently to the charge leg and the pay leg of the same instrument in opposite directions, produces a deterministic, monotonically growing wealth transfer from client to financial institution.
Unlike the atmospheric case, this divergence is not chaotic. It is structural. The settlement infrastructure of global financial institutions computes what the client owes at maximum internal precision and reports what the client is owed at minimum client-facing precision. The difference — δr, the precision gap — is invisible at the transaction level. Across a ~$185 trillion global custody book (early 2026, corrected — see §5), it accumulates to tens of billions of dollars annually.
This paper is grounded in direct operational experience. The author managed custody, treasury, securities lending, and foreign exchange relationships at major global banks, with Latin American central banks — including Banco de México (Banxico), Banco Central do Brasil (BCB), Banco Central de Chile (BCCh), Banco de la República (BanRep), and Banco Central de Reserva del Perú (BCRP) — as counterparties. The mechanism described here was observed in live account reconciliation. Colleagues in the securities services industry with whom the author worked were aware of the arithmetic; it was never surfaced to clients or regulators as a compliance matter.
2. The Two Layers of Asymmetry
2.1 Layer One — Day-Count Convention Asymmetry
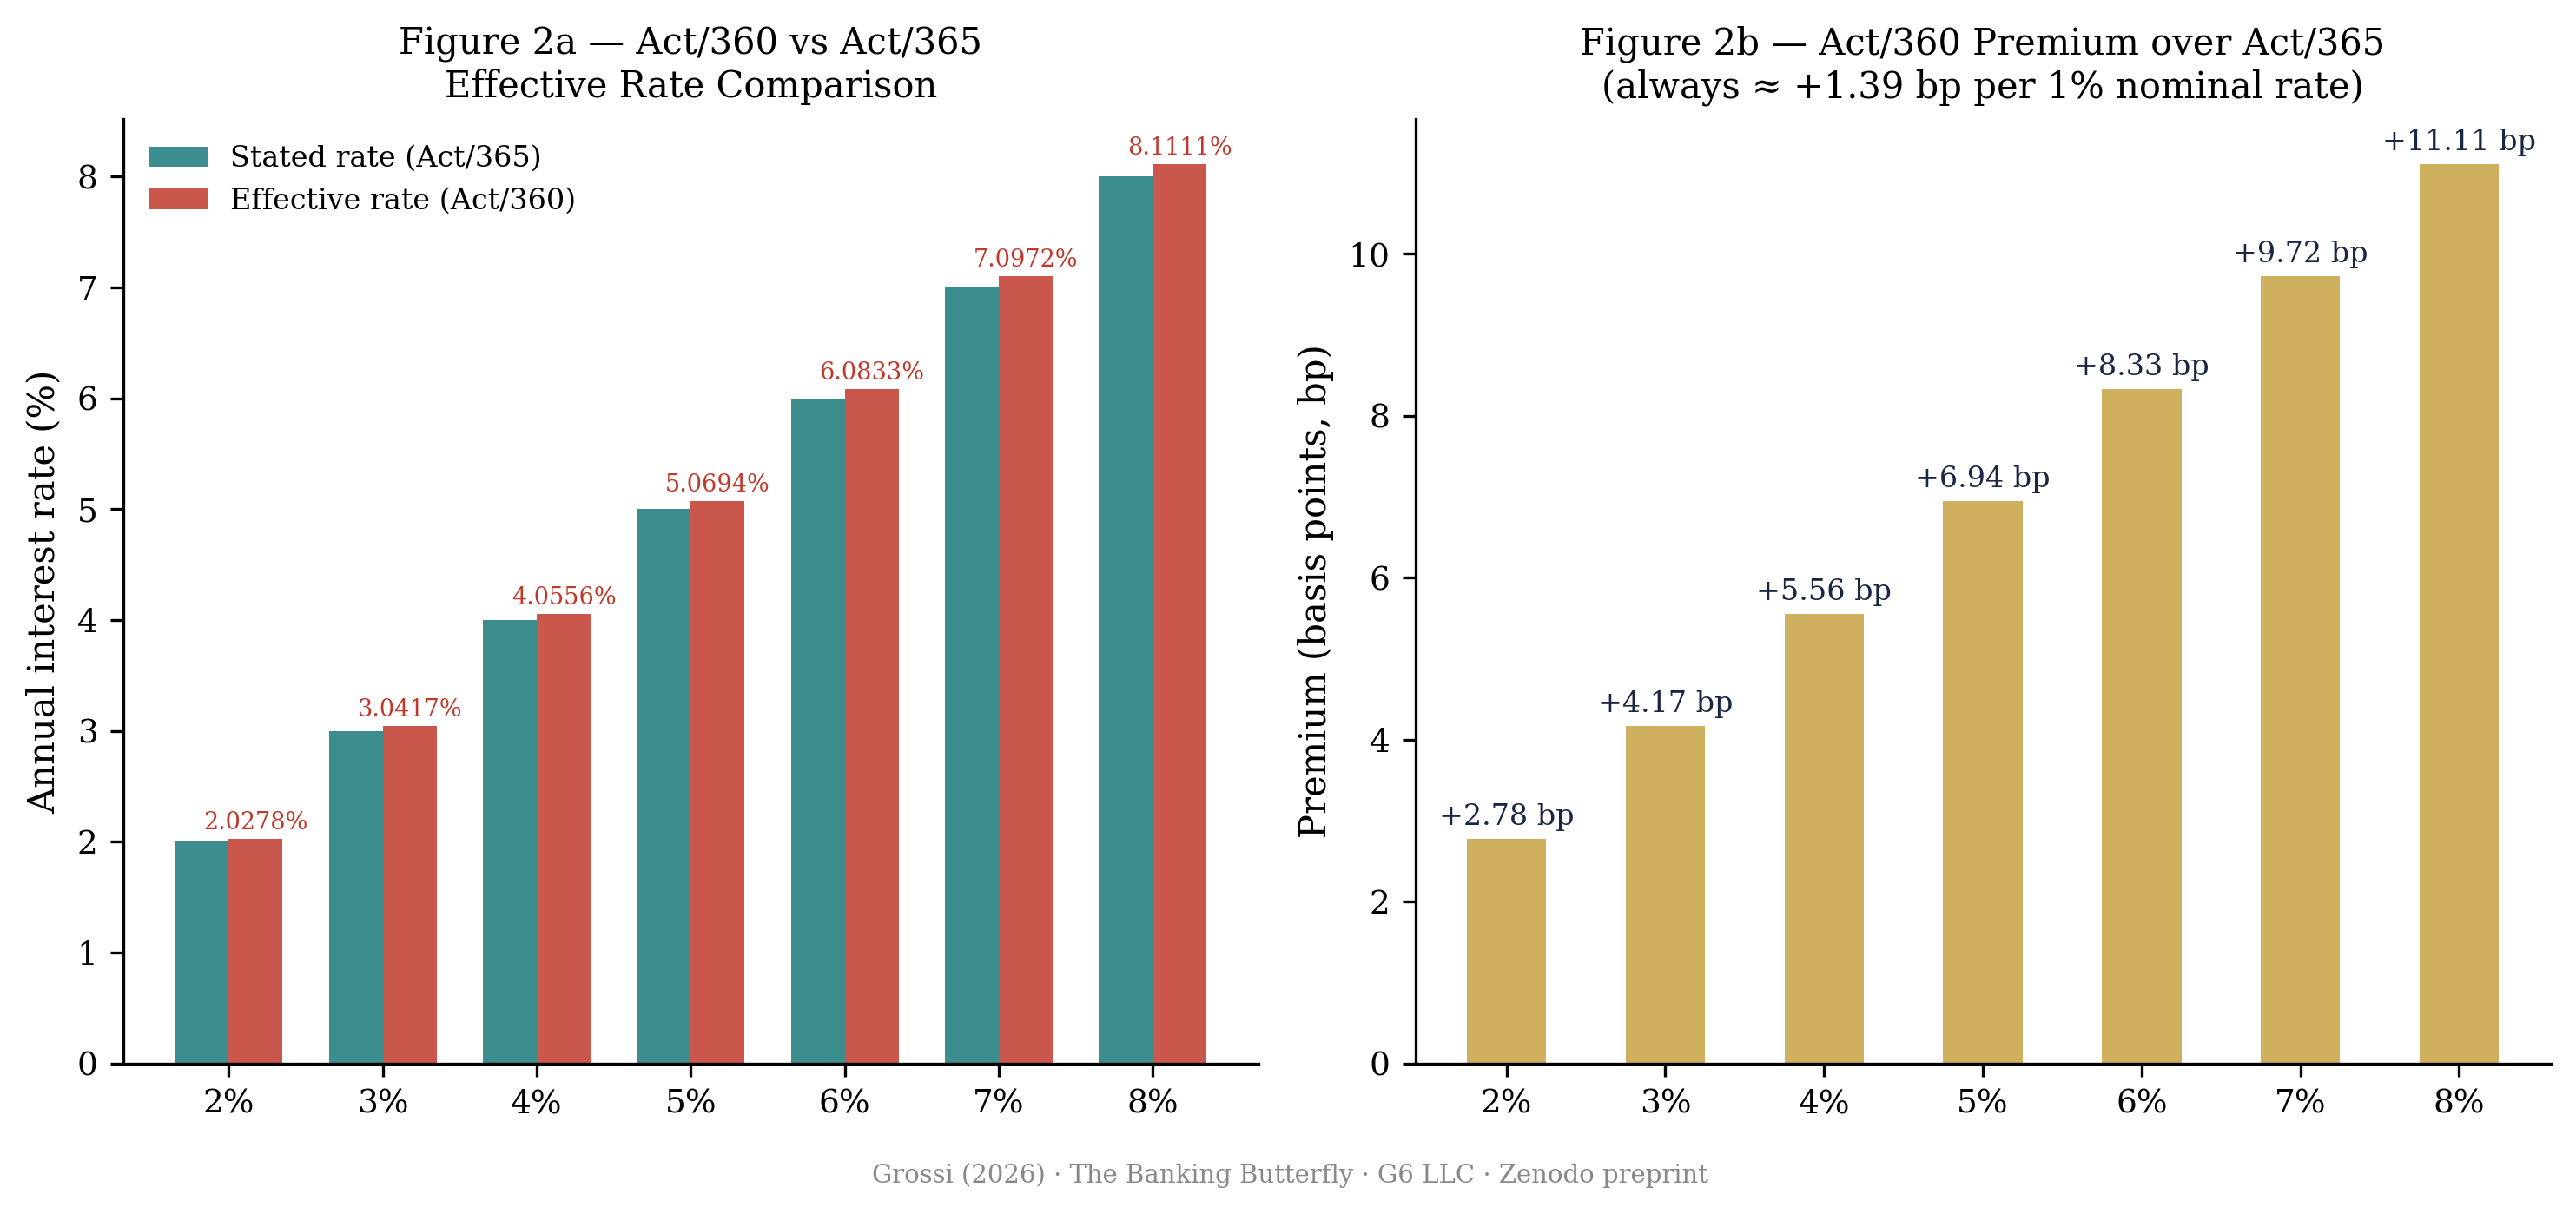
The most documented layer is the day-count convention mismatch. Financial institutions frequently quote interest rates as annual percentages but compute charges using the Act/360 convention — dividing the annual rate by 360 days rather than 365 — while client-facing statements and reference rate benchmarks assume an Act/365 or 30/360 basis. The effective rate charged under Act/360 is:
At a stated rate of 5%, this produces an effective rate of 5.0694% — a premium of 6.94 basis points. The premium scales linearly with the nominal rate (approximately 1.39 bp per 1% of nominal rate) and applies every year, every settlement cycle, on every instrument computed on this basis.
Act/360 is the universal convention in USD money markets, the USD repo market, commercial and industrial loans, commercial real estate loans, CMBS, and syndicated lending.1,2 It is not hidden — it is disclosed in loan agreements and ISDA schedules — but the disclosure is often buried in technical definitions that non-specialist treasury staff at sovereign counterparties do not routinely audit against their actual account statements.
2.2 Layer Two — Precision Truncation Asymmetry
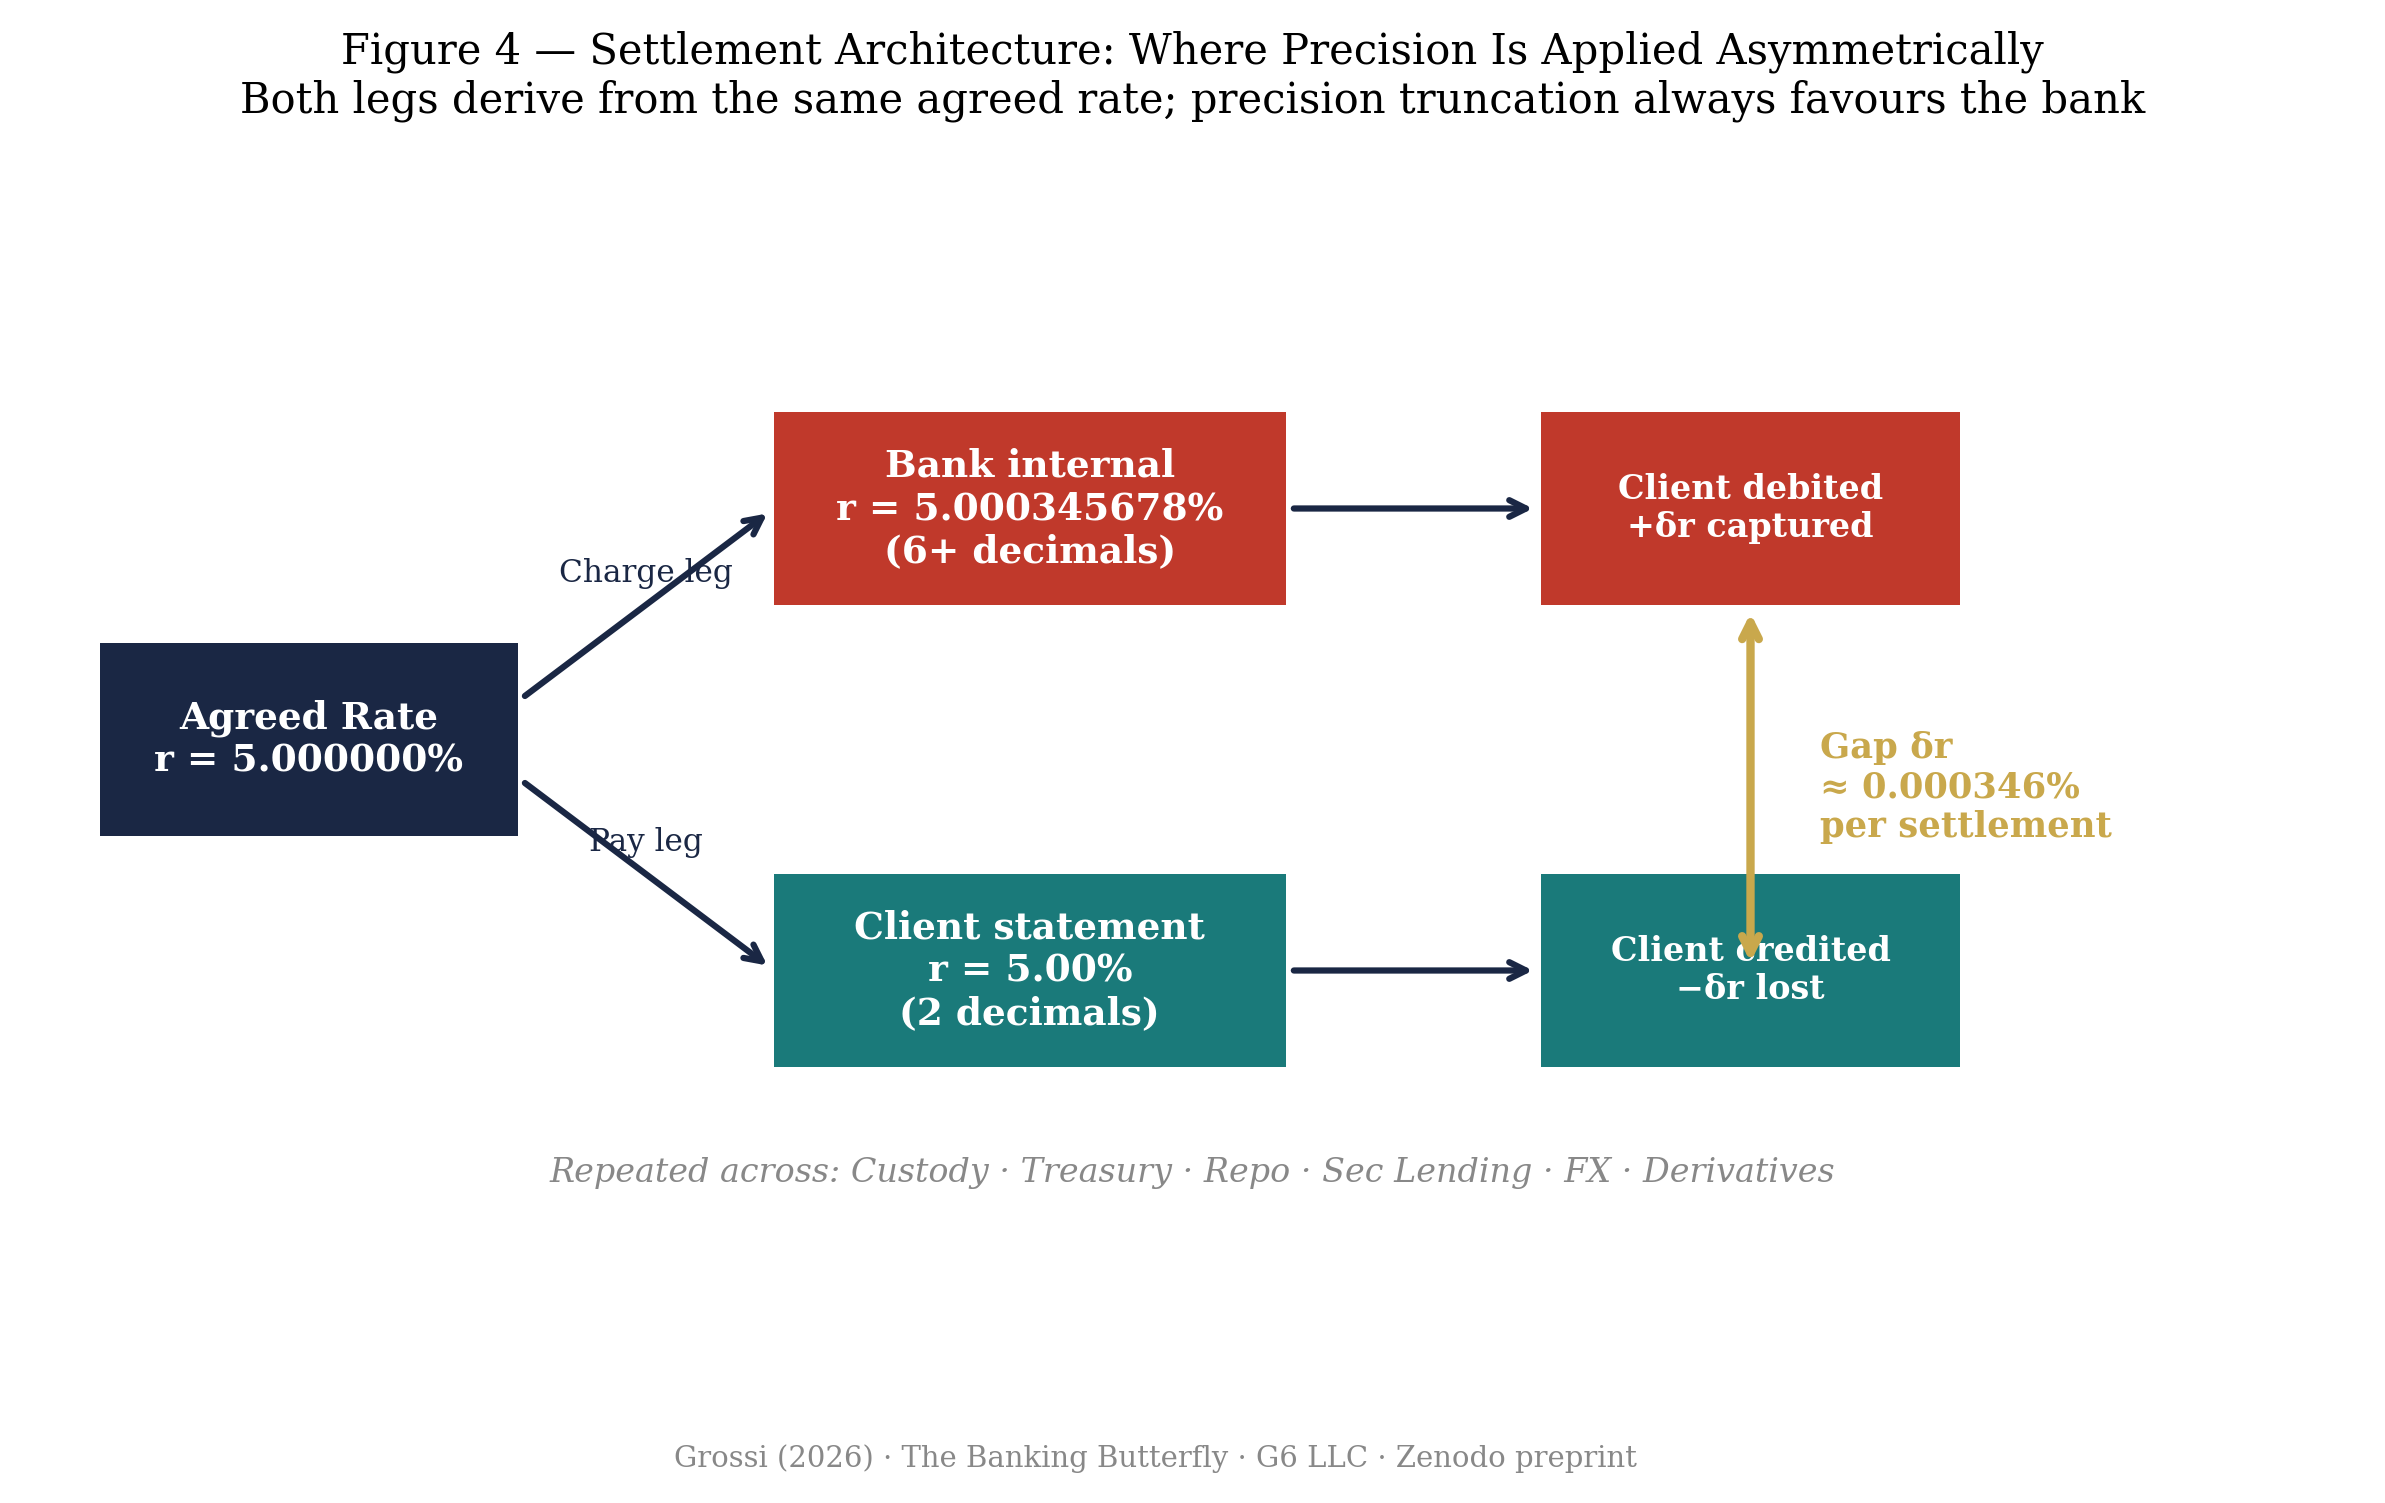
The second layer operates within the computational infrastructure and has, to the author's knowledge, never been named or quantified in the academic literature. When a bank or custodian computes interest on a charge leg — amounts owed to the institution — the internal calculation engine uses the full precision available in the system, typically six to eight decimal places. When it prepares the client statement, the rate applied to the pay leg — amounts owed by the institution — is rounded to two or three decimal places before the multiplication is performed. The agreed rate is identical on both sides of the ledger; the precision applied is not.
Concretely: if the agreed overnight rate is 5.000000%, the bank's charging engine may carry 5.000345678%, while the client's credit confirmation shows 5.00%. The per-settlement precision gap:
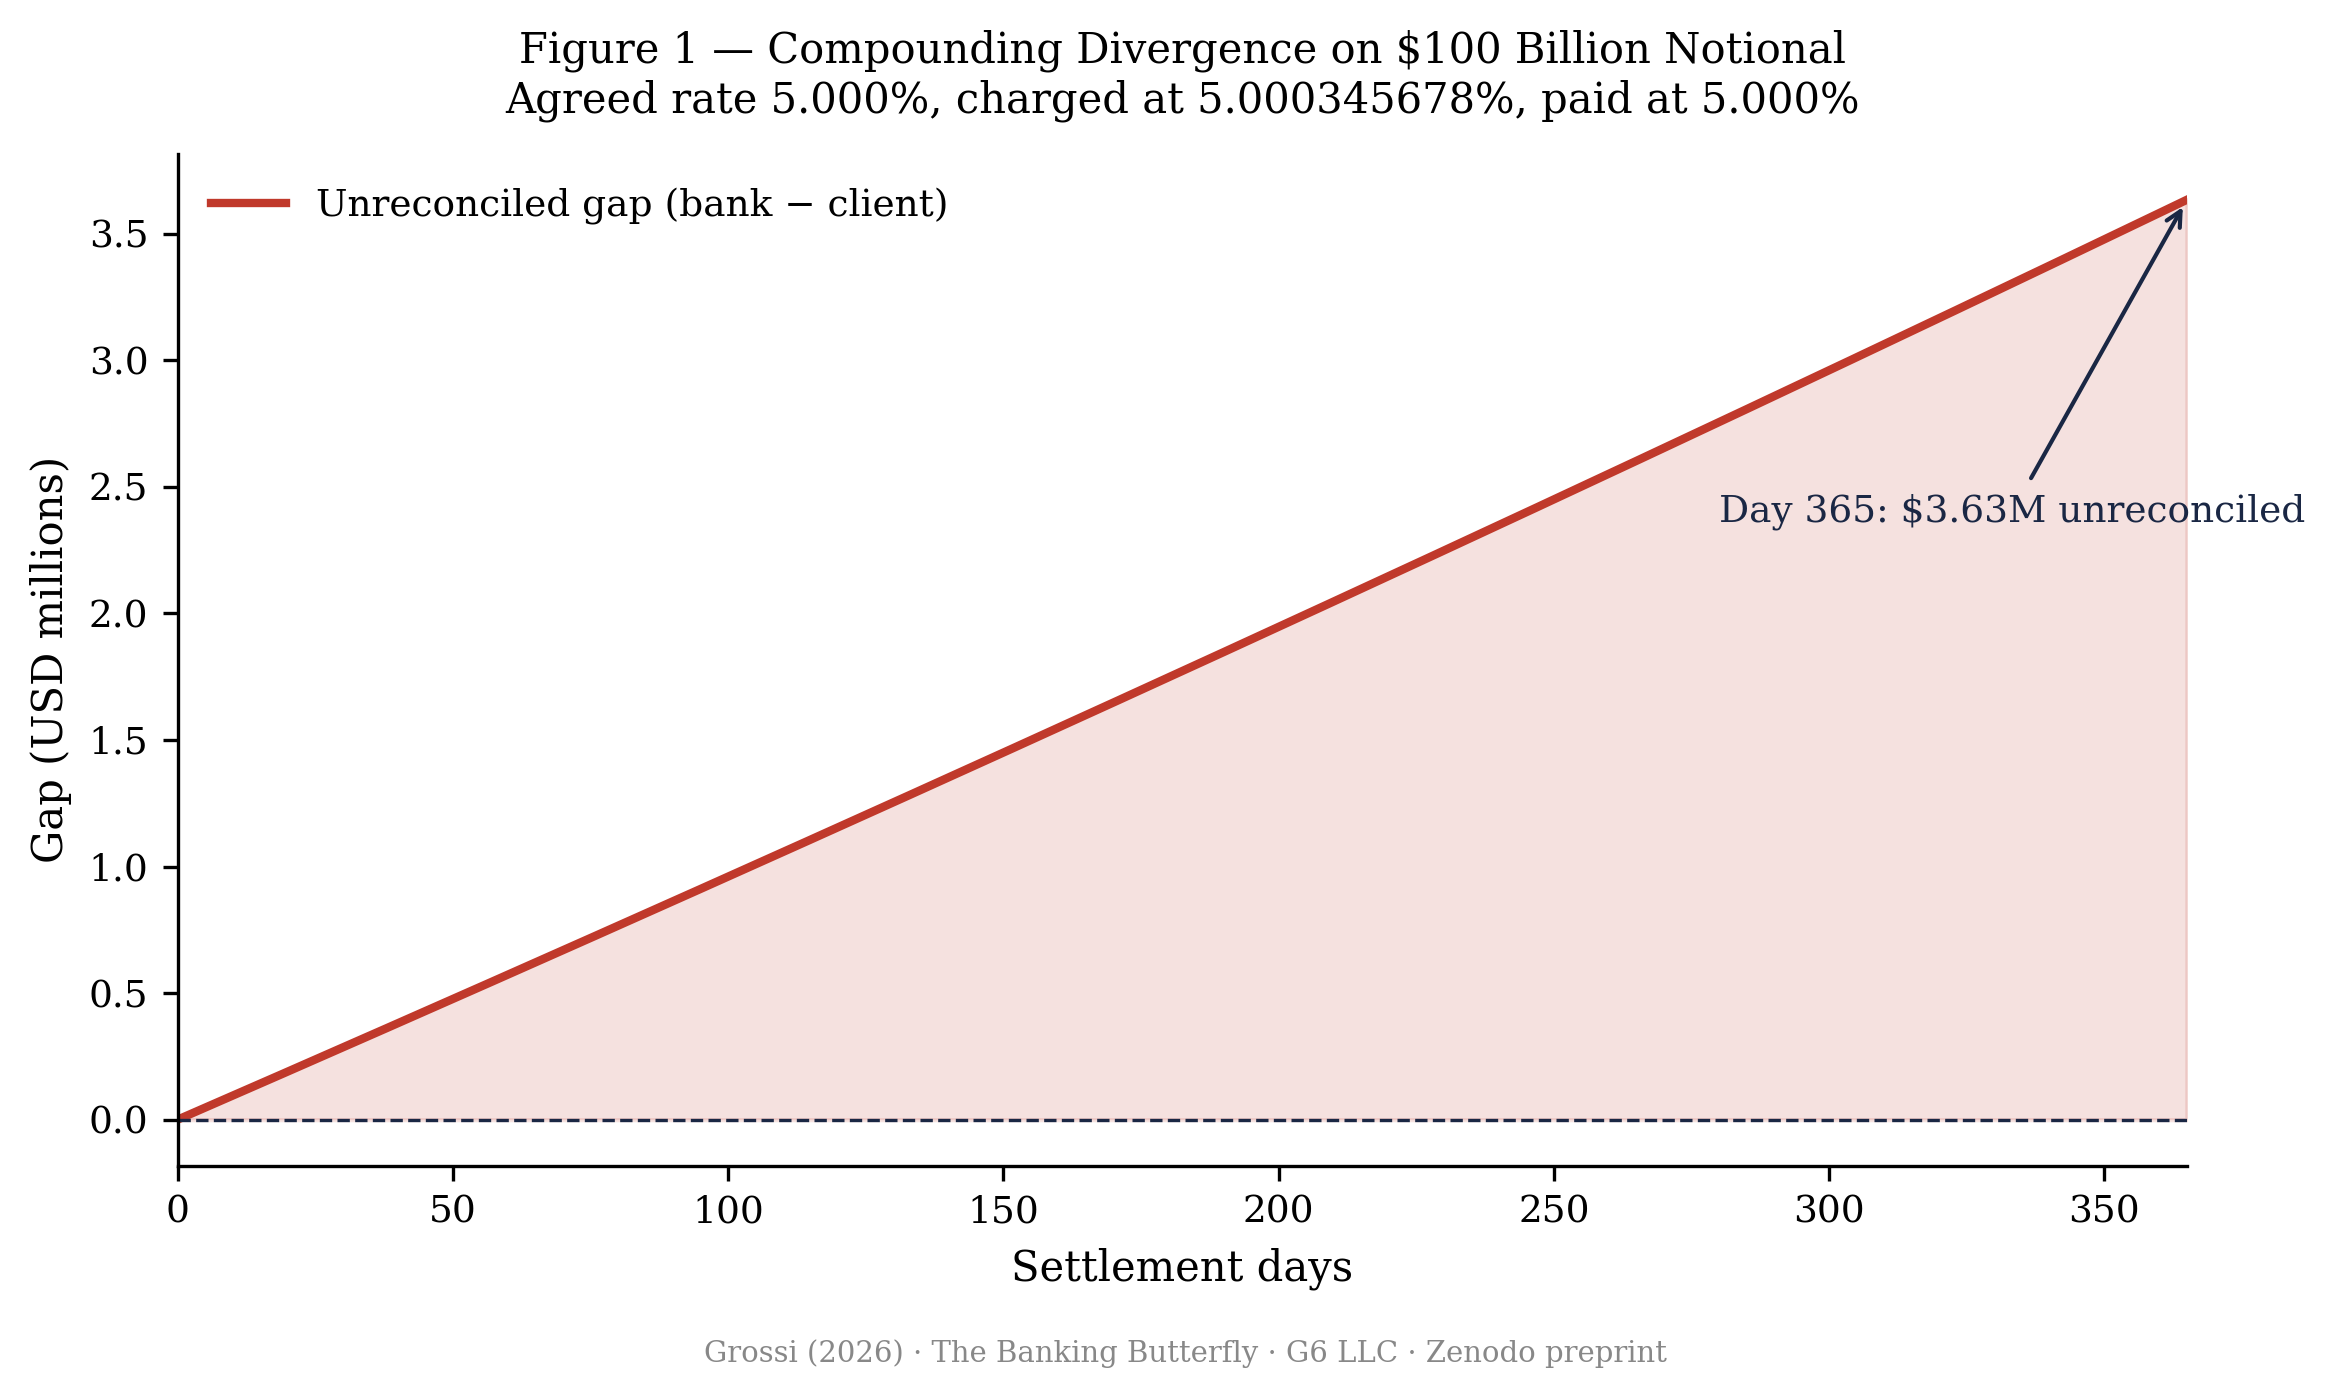
On a $100 billion notional position, this δr generates $345,678 per year — before compounding. The sign of this gap is always the same: positive for the institution, negative for the client. It is not random rounding noise. It is a directional, configurable property of bank settlement systems.
3. The Lorenz Analogy: A Positive Lyapunov Exponent in Settlement Arithmetic
In Lorenz's system, nearby trajectories diverge at a rate characterised by a positive Lyapunov exponent λ > 0. In settlement arithmetic, the analogous structure is deterministic rather than chaotic:
The gap grows monotonically and predictably. The "butterfly" character comes from the initiating perturbation — δr of order 10⁻⁴ to 10⁻⁵ — being small enough to fall below the client's capacity to observe it in any single settlement, while its cumulative effect over a year on a sovereign-scale book is in the tens to hundreds of millions of dollars.
Unlike atmospheric chaos, the outcome is not sensitive to initial conditions in an unpredictable way — it is determined by them in a fully predictable, directional way. The "chaos" is social, not mathematical: the mechanism is invisible because the perturbation is sub-perceptual at the transaction level and the systems that would detect it (client-side reconciliation software) are typically configured to the same truncated precision as the client statement, making independent verification structurally impossible with standard tools.
4. Five Channels of Operation
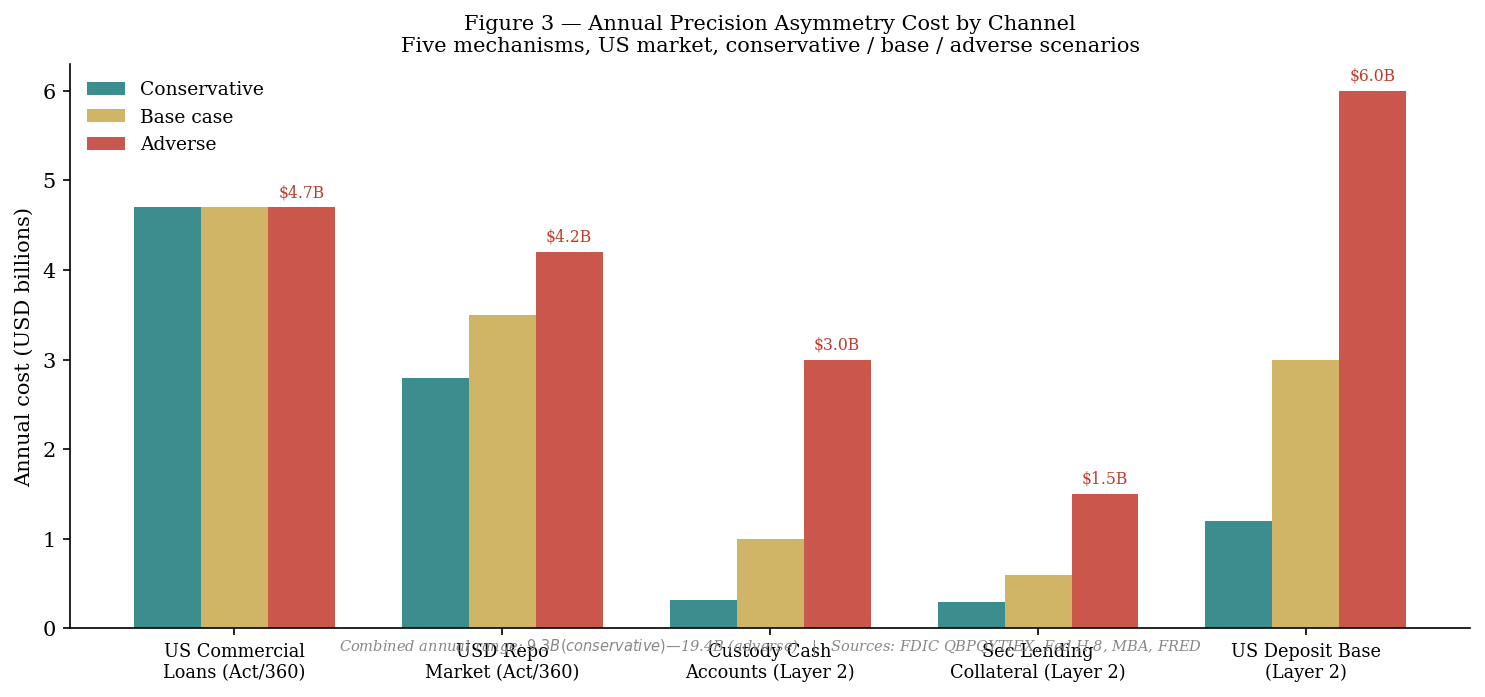
The mechanism does not operate in a single market segment. It operates wherever a financial institution simultaneously holds a charge-leg and a pay-leg position versus the same counterparty at the same agreed rate. Five distinct channels are identified, each with different dominant layers and different base sizes.
| Channel | Primary layer | US/Global base (2024) | Annual cost (base case) |
|---|---|---|---|
| USD repo market | Layer 1 (Act/360) | $4–6T daily outstanding | $2.8–4.2B |
| US commercial loans (C&I + CRE) | Layer 1 (Act/360) | $6.7T outstanding | $4.7B |
| Global custody cash accounts | Layer 2 (precision) | ~$3.7T (2% of ~$185T AUC, corrected) | $0.7–3.5B |
| Securities lending cash collateral | Layer 2 (precision) | ~$2.85T (102% on $2.8T on loan) | $0.3–1.5B |
| US domestic deposit base | Layer 2 (precision) | ~$12T interest-bearing | $1.2–6.0B |
| Combined annual estimate (US market) | $9.7–19.9B¶ | ||
¶ Adjusted only for the custody-channel base-size correction above (§5); the repo, commercial-loan, securities-lending, and deposit-base figures in this table have not themselves been independently re-verified in this pass and are carried over pending the remaining research items listed in the corrigendum.
4.1 Channel 1 — USD Repo Market
The US repurchase agreement (repo) market operates entirely on an Act/360 day-count basis — this is not a lender-specific choice but an industry-wide convention for all USD overnight and term repo. Daily outstanding repo volume in the US typically runs $4–6 trillion. At an average 5% repo rate, the Act/360 premium of 6.94 basis points generates $2.8–4.2 billion in annual excess interest paid by repo borrowers. Sovereign counterparties who use repo to manage short-term liquidity on their reserves pay this premium on every transaction.
4.2 Channel 2 — Commercial Loans
Commercial and industrial (C&I) loans outstanding at US commercial banks: approximately $2.8 trillion (Fed H.8, December 2024). Commercial real estate (CRE) debt outstanding: $3.94 trillion (Federal Reserve Z.1, 2025). Combined Act/360 book: approximately $6.7 trillion.3 Total annual Act/360 premium on this combined book at an average effective rate of 5%: $4.65 billion per year. This channel affects US businesses directly and US households indirectly through the cost of commercial real estate passed into rents, retail prices, and employment costs.
4.3 Channel 3 — Custody Cash Accounts
The four largest global custodians — BNY Mellon ($52.1T), State Street ($46.6T), JPMorgan ($38T), Citi ($24T) — held a combined $160.7 trillion in assets under custody and administration in 2024, approaching $180T by early 2026.4,5,6,7 A fraction of these assets — typically 1–3% — is held as uninvested cash in custody accounts, earning overnight rates credited to clients. On a $160T base, 2% cash = $3.2T in cash on which the precision truncation mechanism applies. At 5% rate and 2bp precision gap: $640M per year from this channel alone. The securities services revenues of the top 12 banks reached $43.9B in 2024,8 of which an undisclosed proportion derives from cash management spreads within custody.
4.4 Channel 4 — Securities Lending Cash Collateral
Global securities lending on-loan balances averaged $2.74 trillion in Q4 2024, generating $976M in monthly revenue at the industry level.9 Cash collateral, typically posted at 102–105% of the loan value, creates a reinvestment pool of approximately $2.85T. The bank reinvests this pool and credits the lending client's account with a share of the reinvestment return. The precision with which the reinvestment rate is computed versus the rate credited to the client is not disclosed or standardised. A precision gap of 0.001% on $2.85T generates $28.5M per year; at 0.005%, $142M. Global securities lending revenue hit a record $15.3 billion in 2025,10 making this the fastest-growing channel of the mechanism.
4.5 Channel 5 — Domestic Deposit Base
Total US bank deposits in 2024 were approximately $18 trillion (FDIC), of which approximately $12 trillion are interest-bearing (savings accounts, money market deposits, CDs, and interest-bearing checking). Total interest expense across FDIC-insured institutions in 2024: approximately $530–545 billion annualised (FRED series QBPQYTIEX, Q4 2024: $137.2B).11 A precision truncation of 0.001–0.005% on the pay leg for $12T of interest-bearing deposits generates $1.2–6.0B per year. This channel directly affects American households — the 153 million US deposit account holders.
5. The Big Four: Assets Under Custody and the Scale of Exposure
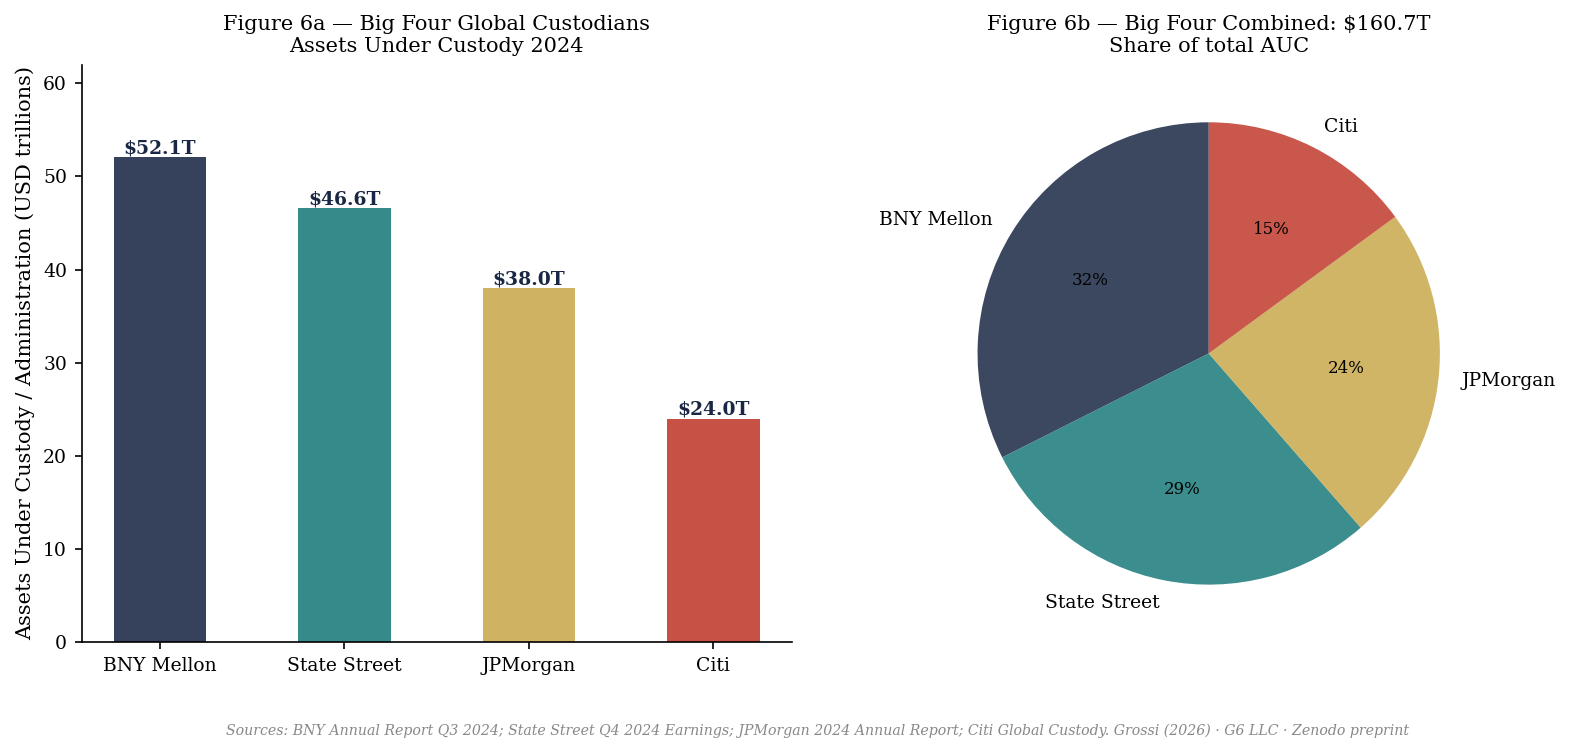
The scale of the custody industry transforms what appears to be a small arithmetic asymmetry into a mechanism of significant macroeconomic consequence. Consider the following: the combined GDP of all nations on Earth in 2024 was approximately $110 trillion. The Big Four custodians now hold approximately $185 trillion in assets (early-2026 figures) on behalf of pension funds, sovereign wealth funds, central banks, insurance companies, and institutional investors. These clients generate cash flows — dividends, coupons, repo interest, securities lending returns — that pass through the custodian's settlement systems daily. On every cash flow, the precision gap operates.
| Custodian | AUC / AUA (2024) | Est. cash in custody (2%) | Annual gap at 2bp (base) |
|---|---|---|---|
| BNY Mellon | $59.4T§ | $1.19T | $238M |
| State Street | $54.5T§ | $1.09T | $218M |
| JPMorgan | >$40.0T§ | $800B | $160M |
| Citi | $31.0T§ | $620B | $124M |
| Big Four combined | ~$185T | $3.70T | $740M/yr |
§ Corrected, current-quarter figures (2025Q4–2026Q1): BNY Mellon and State Street from each bank's own Q1 2026 earnings release (both records, both up materially year-on-year); JPMorgan per trade-press reporting of crossing $40T in late 2025 (exact current point figure not independently pinned down — treat as a floor, not a precise value); Citi per its May 2026 Investor Day (Shahmir Khaliq, Head of Services). The original $160.7T combined figure in earlier drafts of this paper was roughly a year stale.
This table covers only the cash management component (Channel 3) and only the Big Four. Adding securities lending collateral (Channel 4) and the broader deposit and commercial lending bases (Channels 1, 2, and 5) produces the aggregate $9.7–19.9 billion annual estimate across the full US market (custody-channel base corrected to ~$185T; the other four channels' base figures are not yet independently re-verified — see corrigendum).
6. Quantitative Estimates: Annual and Cumulative
Three scenarios are modelled. The conservative scenario assumes the minimum documented asymmetry — primarily the Act/360 premium on commercial loans and repo, with minimal precision truncation on custody and deposits. The base case adds moderate precision truncation across all channels. The adverse scenario reflects full Act/360 exposure plus active precision truncation across custody, securities lending, and deposits.
6.1 Historical Accumulation
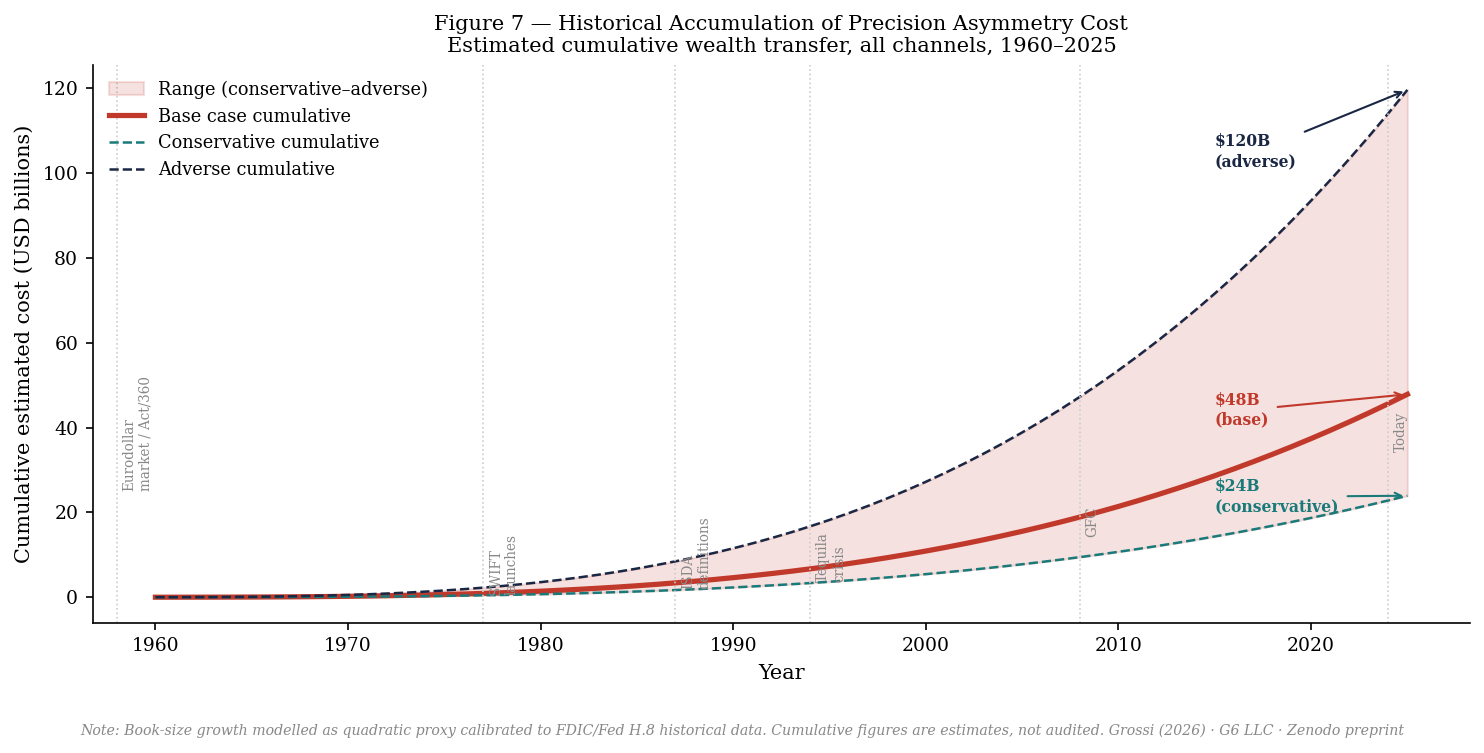
The mechanism has been operating across different time horizons in different channels. Act/360 in the Eurodollar market dates to the late 1950s. SWIFT electronic settlement launched in 1977. ISDA codified day-count conventions in 1987 and 1991. The major bank settlement system vendors (Murex, Misys/Finastra, Calypso, SunGard) were configured and deployed through the 1980s and 1990s — and the precision settings made at deployment have generally not been revisited as a client disclosure matter. For LATAM central banks specifically, the large-book exposure begins with the reserve buildups following the Tequila crisis (1994) and Brazilian Real crisis (1999).
7. LATAM Central Banks: The Largest Exposed Sovereign Clients
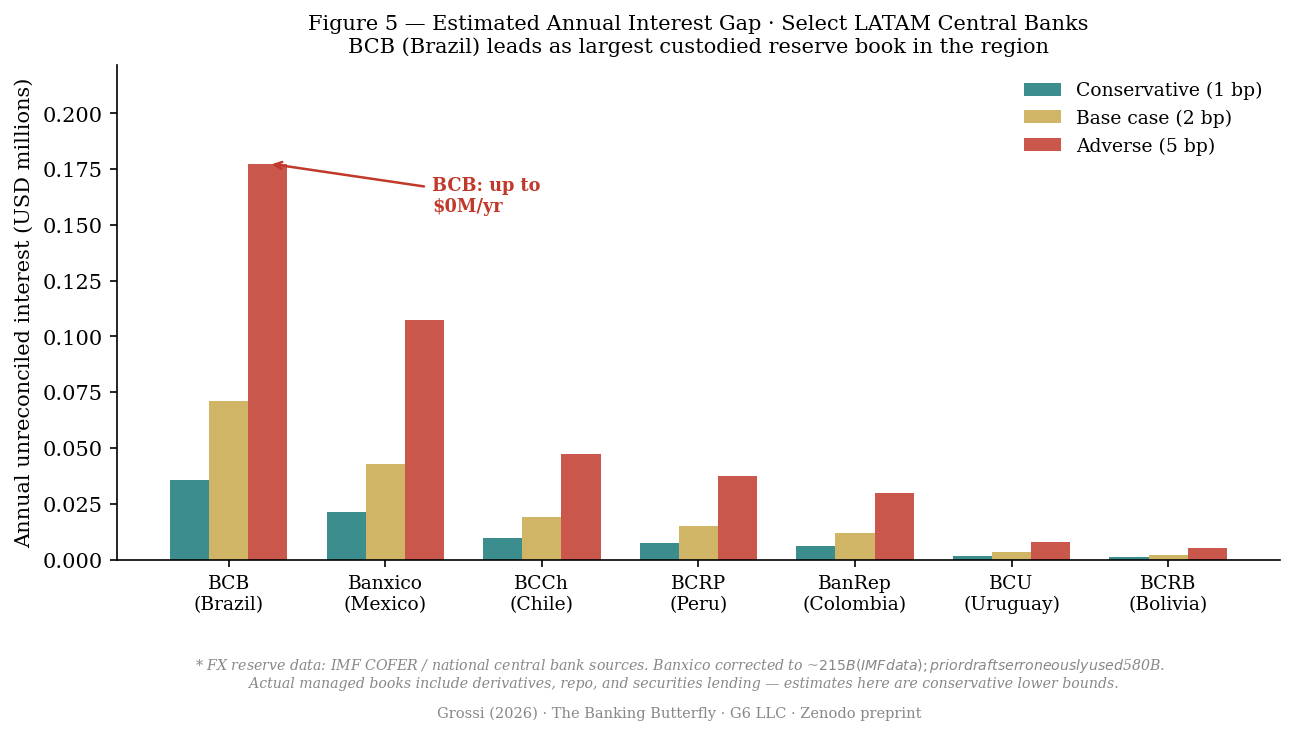
Latin American central banks represent the highest-concentration sovereign exposure to this mechanism outside the major Asian reserve accumulators. The largest reserve holder in the region is BCB (Brazil), whose reserves ran approximately $330–344 billion through 2025 reporting, above Banco de México, whose international reserves rose to approximately $240–252 billion by year-end 2025 (a roughly 10% year-on-year increase, per Banxico's own reporting). An earlier draft of this paper stated $580B for Banxico; that figure was an error and has been corrected in stages — first to ~$215B, and now, per the corrigendum above, to the current ~$240–252B range. Reserve figures move over time and any reader using this paper for current exposure estimates should pull the latest figures directly from IMF COFER or the relevant central bank rather than relying on the point estimates below.
| Central bank | FX reserves (proxy) | Conservative (1bp) | Base (2bp) | Adverse (5bp) |
|---|---|---|---|---|
| BCB — Brazil | ~$340B† | $34M | $68M | $170M |
| Banxico — Mexico | ~$250B† | $25M | $50M | $125M |
| BCCh — Chile | ~$52B† | $5.2M | $10M | $26M |
| BCRP — Peru | ~$100B† | $10M | $20M | $50M |
| BanRep — Colombia | ~$62B† | $6.2M | $12.4M | $31M |
| BCU — Uruguay | ~$18B‡ | $1.8M | $3.6M | $9M |
| BCRB — Bolivia | ~$3.5B† | $0.35M | $0.7M | $1.8M |
| LATAM total (est.) | ~$825B | $83M | $165M | $413M/yr |
† Independently re-verified this pass against each central bank's own current 2026 reporting (Brazil, Mexico, Chile, Peru, Colombia, Bolivia). Bolivia in particular is corrected sharply downward — from an earlier draft's $10B to ~$3.5B — reflecting Bolivia's ongoing dollar-liquidity crisis (BCB's own Q1 2026 report: net international reserves of $3.5429B, down from a pre-crisis level over $3.1B as of early 2023 and far below historical norms). Chile is corrected sharply downward (~$95B → ~$52B); Peru is corrected sharply upward (~$75B → ~$100B, per BCRP/MEF reporting that reserves crossed the $100B mark in April 2026). ‡ Uruguay not independently re-verified by primary-source lookup in this pass; figure taken from a secondary report and should be treated with the same caution as before. Note that the LATAM total is coincidentally close to the original (~$826B → ~$825B) despite every individual country figure changing, several by large margins — the aggregate stability masks substantial per-country correction and should not be read as validating the original row-by-row numbers.
These are conservative estimates. The FX reserve figure is used as a proxy for the managed book, but actual books include repo, derivatives, and securities lending notionals that may be two to five times the reserve figure for active reserve managers. On a $1 trillion effective notional at 5bp combined asymmetry, the LATAM annual loss exceeds $500 million.
Over 25 years of high-exposure operation (1999–2024), the estimated cumulative LATAM loss is $3–10 billion, depending on the scenario and the actual effective notional of each managed book.
7.5 The Brazilian Case: A Dual-Market Supplement
Brazil's credit market illustrates a related but distinct phenomenon worth stating carefully, separating what is independently verifiable from what is not. Petrobras and the Brazilian sovereign borrow in international dollar markets at investment-grade-adjacent rates: Petrobras's dollar-denominated notes have priced with coupons ranging from approximately 2.875% to 6.875% depending on maturity and market conditions (SEC FWP filings, various years). At the retail end of the same national banking system, Brazilian consumers face dramatically higher rates: the average cheque especial (overdraft) rate is capped by Banco Central do Brasil regulation at 8% per month (in force since January 2020), and the average cartão de crédito rotativo (credit-card revolving) rate reached a confirmed 443.3% per year in April 2025 (Banco Central do Brasil data, reported by Agência Brasil and CNN Brasil).
The verifiable core of the comparison stands without the unconfirmed detail: a large, internationally-financeable borrower accesses dollar credit at a low single-digit percentage, while a retail consumer without comparable alternatives faces a regulated-but-still-triple-digit annual rate on unsecured short-term credit, in the same national financial system. Whether that gap reflects credit risk alone or something closer to what this paper calls captivity pricing is an argument, not an established fact, and is presented as such.
Brazil's legal history on interest-rate limits is independently confirmed: the 1988 Constitution's Article 192, §3 set a 12%-per-year real interest rate ceiling, but it was never regulated by the complementary law the provision required, the Supreme Federal Tribunal (STF) held it was not self-executing, and it was formally revoked by Constitutional Amendment 40/2003. Separately, the 1933 Usury Law (Decreto 22.626/1933) caps interest at 12% per year and prohibits compound interest generally — but STF Súmula 596 (a real, confirmed precedent) holds this cap does not apply to institutions within the National Financial System, exempting banks from it. A December 2023 law (confirmed) caps total credit-card debt charges — principal plus interest, fees, and penalties combined — at twice the original invoice amount, addressing the revolving-credit rate problem directly, though it does not touch cheque especial.
8. Literature and Legal Precedents
8.1 The Act/360 Litigation Wave
In Illinois, financial institutions encountered class action lawsuits and mortgage foreclosure defences arising from the 365/360 method (legally equivalent to Act/360). Courts in Cook County generally ruled in favour of lenders on the grounds that the Illinois Interest Act does not apply when a promissory note clearly states the specific basis for interest computation.12 The National Law Review summarised the situation: "borrowers are claiming that the 365/360 method violates the Illinois Interest Act because certain promissory notes refer to interest being calculated 'per annum' or 'annually.'" Illinois subsequently considered legislation validating the 365/360 method. The precedent established — disclosure defeats the claim — is the legal foundation on which Act/360 currently rests throughout the US.
The Federal Housing Administration paid approximately $320 million in a 2012 settlement after borrowers were found to have been charged Act/360 rather than the Act/365 basis stated in their loan documents.13 In Komatsu Financial v. Wells Fargo Bank (N.D. Ill. 2015), the court found Act/360 to be a separately negotiable term that cannot be assumed as a market standard without disclosure.
8.2 Why the Disclosure Defence Does Not Apply to Layer 2
The legal precedents above apply exclusively to Layer 1 — the Act/360 day-count convention — which is typically disclosed in loan documents, even if the disclosure is not prominent. Layer 2 — precision truncation — has no equivalent disclosure. No client-facing term sheet, ISDA schedule, or custody agreement specifies the decimal precision that will be applied to the charge leg versus the pay leg of each settlement. The disclosure defence therefore does not apply to Layer 2: there is nothing disclosed.
This distinction is legally significant. The LIBOR manipulation settlements (2012–2016) established that basis-point-level asymmetry in interbank rate setting constitutes market manipulation under US and UK law, with aggregate fines exceeding $9 billion. Layer 2 operates at sub-basis-point precision (0.0001–0.001%) — below individual LIBOR manipulation magnitude — but the structural directionality (always positive for the bank, never for the client) is precisely what distinguished LIBOR manipulation from random dealer error in the regulatory findings.
8.3 Prior Literature
Fabozzi (2012) documents day-count conventions comprehensively but does not address the precision truncation layer or its aggregate magnitude.14 Lyons (2001) identifies sub-pip precision asymmetry in FX dealer behaviour but does not extend the analysis to custody or settlement.15 Chalmers, Edelen & Kadlec (2001) document rounding asymmetry in mutual fund NAV computation as a systematic wealth transfer, the closest analogue in the academic literature.16 None of these papers models the mechanism as a positive Lyapunov exponent in settlement arithmetic, aggregates across all five channels, or addresses sovereign-scale custody books. To the author's knowledge, no prior paper names or quantifies the precision truncation layer.
9. The dm³ Reading: Operator Non-Commutativity in Settlement Architecture
Within the dm³ framework (Grossi, 202617), the settlement architecture instantiates a case of operator non-commutativity. The operator chain G = U ∘ F ∘ K ∘ C maps initial conditions through constraint (C), folding (F), kinetic closure (K), and unity (U). The key property is [K, F] ≠ 0: the order in which constraint and folding are applied determines the outcome.
In the settlement context: C is the agreed rate; F is the precision function applied to that rate; K is the compounding rule (daily, monthly, Act/360 vs. Act/365). Applying F before K on the charge leg (internal precision, then compound) and K before F on the pay leg (compound at agreed rate, then truncate before reporting) is exactly [K, F] ≠ 0 applied asymmetrically. The consequence mirrors the zeolite selectivity result (Grossi & collaborators, 202618): in ZSM-5, C→K→F→U (constraint first) produces near-zero selectivity variance; in MCM-22, C→F→K→U (folding first) produces 35× selectivity amplification. In settlement, the asymmetric application of F before vs. after K — always chosen to favour the institution — produces a deterministic, monotonically growing wealth transfer.
10. Three Diagnostic Tests for Central Banks
Test 1 — Charge-leg vs. pay-leg precision audit
Extract a sample of 1,000 consecutive settlements across all instrument types from the custodian bank. For each settlement, record (a) the rate applied on the charge leg, taken from the bank's own internal confirmation or SWIFT MT message, and (b) the rate appearing on the client credit confirmation for the pay leg. Compute δr = r_charge − r_pay for each pair. If the mean of δr is significantly positive and the sign is consistent — always positive, never negative — the asymmetry is structural. A Kolmogorov–Smirnov test against the null of zero-mean symmetric δr provides the statistical test. This test requires no access to bank systems — only the client's own incoming and outgoing confirmations.
Test 2 — Day-count convention reconciliation
For all USD-denominated fixed-income positions in custody, request from the custodian bank the day-count convention applied to each accrual computation. Compare to the convention specified in the original trade confirmation or ISDA schedule. For all Act/360 positions not explicitly agreed as Act/360 in the term sheet, compute the effective rate premium r × (365/360) − r and aggregate across the book. This test can be completed in a single spreadsheet using data the central bank already holds.
Test 3 — Long-horizon settlement reconciliation
Select a position held in custody for three or more years with the same custodian. Recompute all interest accruals from inception using the rate specified in the original trade confirmation, applied at the precision stated in that confirmation (typically 2–4 decimal places), using Act/365 and a 365-day year. Compare the recomputed total to the sum of all credits received on the pay leg. The difference is the cumulative unreconciled gap for that position. This test requires no current system access — only original trade confirmations and historical custody statements, both of which the central bank possesses and which custodian agreements require the custodian to retain.
11. Policy Recommendations
11.1 Model Contract Clause
The following clause should be incorporated into all custodian agreements and ISDA master agreements between financial institutions and sovereign counterparties:
11.2 Examination Standard
Banking supervisors — the OCC for nationally chartered banks, the Federal Reserve for state-chartered members and BHCs, the FDIC for state non-members — should add the following to standard safety and soundness examination procedures: a review of the settlement system configuration for day-count convention and decimal precision on charge legs versus pay legs for each asset class. Examiners should request a sample of 500 settlements across five asset classes and independently recompute both legs to verify precision equivalence. Where material asymmetry is found, examiners should assess whether disclosure is adequate under 12 CFR Part 1026 (Regulation Z) and applicable ISDA definitions.
11.3 CEMLA Coordination Recommendation
CEMLA member central banks — representing 50+ institutions managing combined reserves exceeding $1 trillion — should adopt a coordinated protocol requiring custodian banks seeking to manage LATAM sovereign reserves to provide annual precision certification as described in §11.1. A CEMLA working group on settlement precision standards, coordinating with the BIS Committee on Payments and Market Infrastructures (CPMI), could establish this as a regional best practice and create the data infrastructure for the empirical validation of this paper's estimates.
12. Conclusions
This paper identifies and names a structural mechanism — decimal precision asymmetry — operating across five channels of the global financial system. In the USD repo market ($4–6T daily), US commercial loans ($6.7T), global custody cash accounts ($3.7T within a ~$185T AUC base, corrected — see §5), securities lending cash collateral ($2.85T), and the US domestic deposit base ($12T interest-bearing), financial institutions systematically compute what counterparties owe them at higher decimal precision than what they owe counterparties. The mechanism has two layers: Act/360 day-count asymmetry (documented, legally defended on disclosure grounds) and precision truncation (undocumented, not disclosed, not examined).
The estimated annual cost across all five channels in the US market is $9.7–19.9 billion (custody-channel base corrected this pass to ~$185T; the repo, commercial-loan, securities-lending, and deposit-base figures have not yet been independently re-verified). The cumulative cost since computerised settlement standardised these configurations in the mid-1980s is estimated at $150–350 billion — this range has not itself been recalculated from the corrected bases and should be treated as provisional. For LATAM central banks alone, the annual cost is $83–413 million (recalculated from corrected reserve figures — see §7); the 25-year cumulative cost is $3–10 billion.
The mechanism does not require intent or individual wrongdoing. It is a structural feature of how bank settlement systems were configured during the computerisation of financial infrastructure — a configuration choice that has never been made visible to clients or supervisors. This paper makes it visible. The three diagnostic tests in §10 allow any central bank to measure their own exposure using data they already hold. The policy recommendations in §11 provide a template for contract clauses and examination standards that cost nothing to implement.
The author observes that the scale of the Big Four custodians — $160 trillion in assets under custody against a global GDP of $110 trillion — makes the custody channel the most structurally significant, even if its per-dollar precision gap is smaller than the Act/360 premium in commercial lending. When the mechanism operates on assets exceeding global GDP, even a sub-basis-point asymmetry becomes a policy matter.
References
[1] Fabozzi, F.J. (2012). Bond Mathematics: The Theory Behind the Formulas. Wiley Finance. §2: Day Count Conventions.
[2] ISDA (1991, 2006). 2006 ISDA Definitions, Section 4.16: Day Count Fractions. International Swaps and Derivatives Association. Available at isda.org.
[3] Mortgage Bankers Association (2025). "Total Commercial Real Estate Borrowing and Lending Increased 16 Percent in 2024." MBA Newsroom, April 24, 2025. Federal Reserve Z.1 Financial Accounts of the United States, March 2025.
[4] BNY Mellon (2024). Q3 2024 Earnings Release: Assets under custody and/or administration: $52.1 trillion. bny.com.
[5] State Street Corporation (2025). "Fourth-Quarter and Full-Year 2024 Financial Results." Assets under custody and/or administration: $46.6 trillion. investors.statestreet.com.
[6] JPMorgan Chase (2024). Mid-2024 disclosure citing $38 trillion in assets under custody (as of 6/30/2024); figure reconciled to $38T throughout this paper per the corrigendum above. jpmorganchase.com.
[7] Global Custodian (2026). "A New Era of Custody: How the Biggest Four Players are Shaping the Future of Global Securities Services." January 2026. globalcustodian.com.
[8] S&P Global Market Intelligence (2025). "Global Securities Services Revenues Seen Resilient to 2025 Turmoil." Combined revenues of top 12 banks: $43.9B in 2024. spglobal.com.
[9] S&P Global Market Intelligence (2025). "Securities Finance December, Q4, H2 and Full Year Snapshot 2024." Average on-loan balances Q4 2024: $2.74 trillion; monthly revenue December 2024: $976M.
[10] Hedgeweek (2025). "Global Securities Lending Revenue Hits Record $15.3bn in 2025." hedgeweek.com.
[11] Federal Reserve Bank of St. Louis — FRED (2026). QBPQYTIEX: Income and Expense: Total Interest Expense, FDIC-insured commercial banks. Q4 2024: $137,187.812M. fred.stlouisfed.org/series/QBPQYTIEX.
[12] Shapiro, E.D., Much Shelist P.C. (2010). "The 365/360 Method of Calculating Interest: Lenders and Borrowers Square Off." National Law Review, May 30, 2010. natlawreview.com.
[13] U.S. Department of Justice (2012). "FHA Settlement — Act/360 Overcharge." Press release, February 9, 2012. justice.gov.
[14] Fabozzi, F.J. (2012). Op. cit.
[15] Lyons, R.K. (2001). The Microstructure Approach to Exchange Rates. MIT Press. Ch. 3.
[16] Chalmers, J.M.R., Edelen, R.M., & Kadlec, G.B. (2001). "On the perils of financial intermediaries setting security prices: The mutual fund wild card option." Journal of Finance, 56(6), 2209–2236.
[17] Grossi, P.N. (2026). Principia Orthogona — Series dm³, Volume II: TOGT. Zenodo. doi:10.5281/zenodo.20159456.
[18] Grossi, P.N. (2026). "Contact-Geometric Theory of Generative Transitions." Zenodo. doi:10.5281/zenodo.20682933.
[19] Adventures in CRE (2025). "30/360, Actual/365, and Actual/360 — How Lenders Calculate Interest on CRE Loans." adventuresincre.com/lenders-calcs. Updated July 2025.
[20] Lorenz, E.N. (1963). "Deterministic Nonperiodic Flow." Journal of the Atmospheric Sciences, 20(2), 130–141.
© 2026 Pablo Nogueira Grossi · G6 LLC · Newark, NJ · CC BY 4.0.
This preprint has not been peer-reviewed. Cite as: Grossi, P.N. (2026). "The Banking Butterfly: Decimal Precision Asymmetry in Interest Rate Settlement as a Systematic Wealth Transfer Mechanism." G6 LLC Research Working Paper / Zenodo preprint. doi:10.5281/zenodo.20779418.